In short: SMI is an index of orders in the last half hour compared to the first half hour.
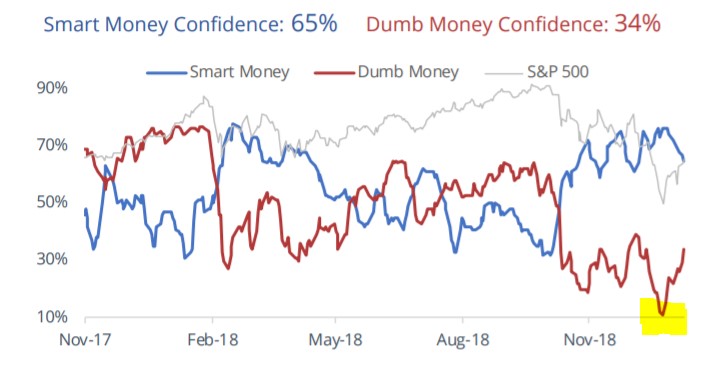
The Smart Money Index, or Smart Money Flow Index, was popularized by Don Hayes in the 1990s and seeks to understand what the “smart money” is doing relative to the “dumb money”. This indicator exists in different variations, but is based on the same concept:
- The “dumb money” trades at the start of the day since they’re emotionally reacting to the overnight or early morning news. Trading on the news is not a smart thing to do. Meanwhile…
- The “smart money” trades during the last hour of each trading day since they spend the day evaluating the market’s price action.

As a result of this concept, the Smart Money Index states that savvy investors and traders should bet on the stock market’s direction towards the end of the day since that is what the “smart money” is doing, and bet against the stock market’s direction at the start of the day since that is what the “dumb money” is doing.
How is this indicator calculated?
So how exactly is the Smart Money Flow Indicator calculated? What counts as “start of the day” and what counts as “end of the day?
- Calculate the S&P 500’s nominal gain or loss during the first half hour of trading (9:30 a.m. – 10 a.m.)
- Calculate the S&P 500’s nominal gain or loss during the last hour of trading (3 p.m. – 4 p.m.)
- Today’s Smart Money Index = yesterday’s Smart Money Index – the market’s gain/loss in the first half hour of trading today + the market’s gain/loss in the last hour of trading today.
Here’s an example. Let’s assume that the Smart Money Index’s value yesterday was 5,000. The S&P lost -14 points this morning and gained +8 points this afternoon. The Smart Money Index’s latest value is now 5000 – (-14) + (+8) = 5022.
Here’s another example. Let’s assume that the Smart Money Index’s value yesterday was 5,000. The S&P rallied +9 points this morning, and gained +7 points this afternoon. The Smart Money Index’s latest value is now 5000 – 9 + 7 = 4998.
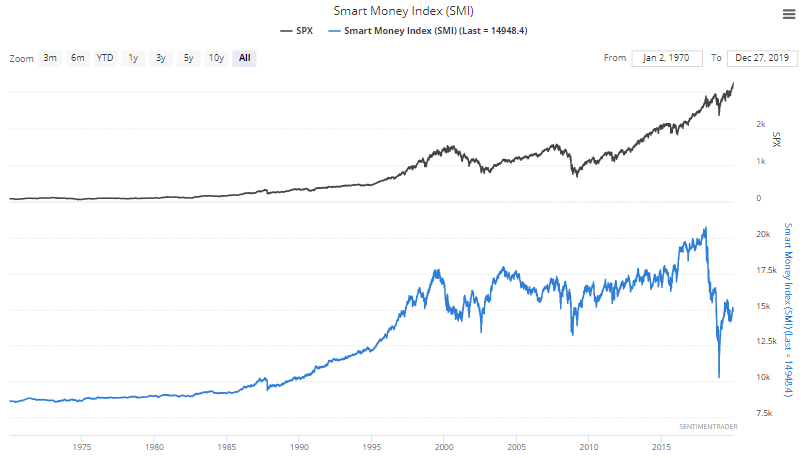
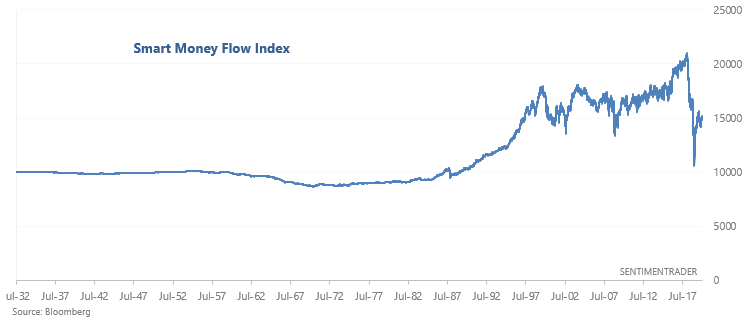
The Smart Money Flow Index can be calculated for any stock market index. The one that’s frequently quoted in mainstream media is for the Dow Jones Industrial Average. But since the S&P 500 is a better representation of the overall U.S. stock market, we have calculated the SMI for the S&P 500. Here’s what this indicator looks like:

If you have a Bloomberg Terminal, you can find this indicator going back to the 1930s for the Dow Jones Industrial Average.

