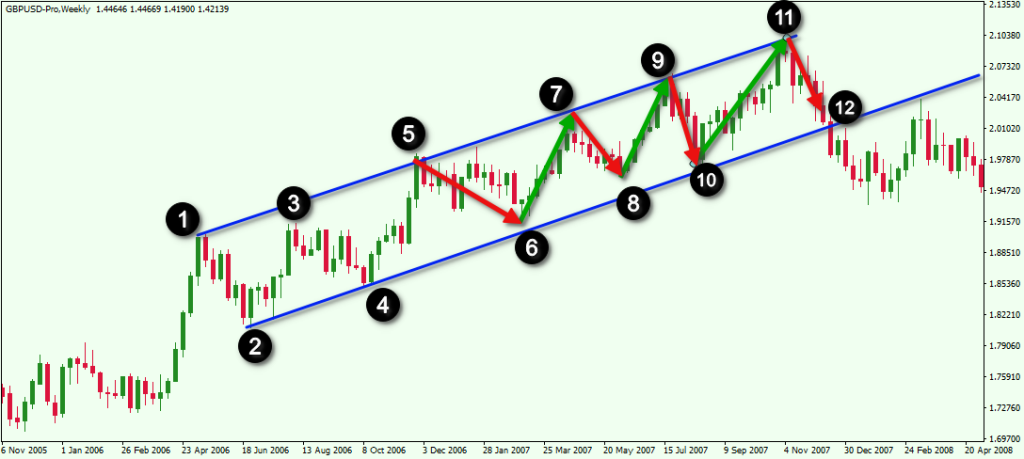
In short: Trendlines are used in TA to quickly point out the general direction of a stockprice by connecting the highs and the lows.
Unlike horizontal support and resistance, trendlines are diagonal or slanted areas of value. Trendlines do behave like support and resistance in that price action can be confined between two trendlines that form a channel.

Trendlines are considered one of the most fundamental tools in technical analysis, they are easy to draw and simple to understand. Traders use trendlines to identify which direction price is moving and potential areas to buy or sell as they can be relevant far out into the future.
How to draw trendlines
It’s important that trend lines are drawn correctly because you are relying on them to indicate an area to buy or sell. Sloppy trendlines can easily lead to missed profits and increase your losses if you can’t properly identify what is low and what is high.
Here are my top tips for drawing trend lines:
1. Zoom out. You want to see the big picture and filter out the noise. This will help you identify trap regions. Try to fit the most number of relevant candles on the screen and turn off any other indicators that may distract you while drawing.
2. Draw most obvious levels. It’s paramount to keep things simple when drawing trendlines, you shouldn’t need to squint to see where your lines should go. Start drawing your trendline at the most obvious swing high or swing low.
3. Use the Candle Body. Wicks are an indication of trap regions, which are the most profitable regions to spread out your orders. Draw your trend lines along the body of the candles to identify the strongest area or support or resistance.
4. Adjust for most contact. Start drawing your trend line using the first two peaks in the trend and then adjust the line until the most number of candle body peaks in the trend are touching the line. Some peaks will break out of the trend but more than likely will return to the other side, these are the trap areas most profitable areas for buys and sells.
5. Extend your lines. Once you have drawn your initial line, start expanding the line outward in both directions. The more relevant points (confirmations) along the line, the stronger it is.
6. Draw Additional Lines. Draw another line to clearly identify trap zones, this line is typically drawn along the wicks of a trend. Trendlines are generally considered broken when price exits a trap zone and then bounces away from the zone on a retest. Additional lines can be drawn to form channels and chart patterns.
How to trade trendlines
Trendlines are easy to draw but that doesn’t make them easy to trade. Generally speaking you want to long (buy) bullish trendline support and short (sell) bearish trendline resistance, as the saying goes “the trend is your friend“.
Find an instrument in an uptrend (ramping up) and look for buying opprotunities when the price drops down to the upward trendline. Just beware of the potential for the trendline to break, this is where other indicators and strategies come into play.
When an instrument is down trending (slanting down) you can find opportunities to short sell when price is getting close to the line. Parallel trendlines can be drawn to form a channel where you buy the lower support line and sell the upper resistance line.
