In short: A stochastic oscillator is an indicator comparing a closing price to a range of prices over a certain period of time. It is used to generate overbought and oversold trading signals.

Developed by George C. Lane in the late 1950s, the Stochastic Oscillator is a momentum indicator that shows the location of the close relative to the high-low range over a set number of periods. According to an interview with Lane, the Stochastic Oscillator “doesn’t follow price, it doesn’t follow volume or anything like that. It follows the speed or the momentum of price. As a rule, the momentum changes direction before price.” As such, bullish and bearish divergences in the Stochastic Oscillator can be used to foreshadow reversals. This was the first, and most important, signal that Lane identified. Lane also used this oscillator to identify bull and bear set-ups to anticipate a future reversal. As the Stochastic Oscillator is range-bound, it is also useful for identifying overbought and oversold levels.
The Stochastic Oscillator measures the level of the close relative to the high-low range over a given period of time. Assume that the highest high equals 110, the lowest low equals 100 and the close equals 108. The high-low range is 10, which is the denominator in the %K formula. The close less the lowest low equals 8, which is the numerator. 8 divided by 10 equals .80 or 80%. Multiply this number by 100 to find %K. %K would equal 30 if the close was at 103 (.30 x 100). The Stochastic Oscillator is above 50 when the close is in the upper half of the range and below 50 when the close is in the lower half. Low readings (below 20) indicate that price is near its low for the given time period. High readings (above 80) indicate that price is near its high for the given time period. The IBM example above shows three 14-day ranges (yellow areas) with the closing price at the end of the period (red dotted) line. The Stochastic Oscillator equals 91 when the close was at the top of the range, 15 when it was near the bottom and 57 when it was in the middle of the range.
While momentum oscillators are best suited for trading ranges, they can also be used with securities that trend, provided the trend takes on a zigzag format. Pullbacks are part of uptrends that zigzag higher. Bounces are part of downtrends that zigzag lower. In this regard, the Stochastic Oscillator can be used to identify opportunities in harmony with the bigger trend.
The indicator can also be used to identify turns near support or resistance. Should a security trade near support with an oversold Stochastic Oscillator, look for a break above 20 to signal an upturn and successful support test. Conversely, should a security trade near resistance with an overbought Stochastic Oscillator, look for a break below 80 to signal a downturn and resistance failure.
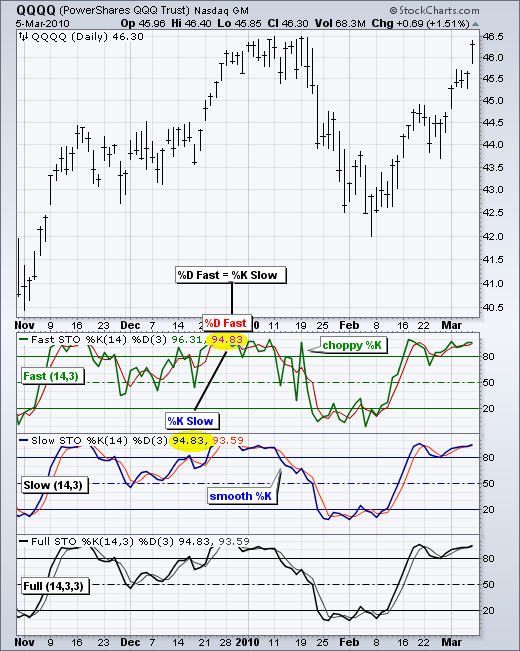
The settings on the Stochastic Oscillator depend on personal preferences, trading style and timeframe. A shorter look-back period will produce a choppy oscillator with many overbought and oversold readings. A longer look-back period will provide a smoother oscillator with fewer overbought and oversold readings.
Like all technical indicators, it is important to use the Stochastic Oscillator in conjunction with other technical analysis tools. Volume, support/resistance and breakouts can be used to confirm or refute signals produced by the Stochastic Oscillator.
