Categorie: WIKIPEDIA
Bitcoin/Tulip-o-mania. History repeats…
What does GAS (and gwei) mean in crypto terms?

In short: “A blockchain network needs some form of energy to keep going, and this energy is usually the computational power that will help users complete orders. That energy is called gas or gas=fee. For the Etherium network the gasfee is measured in GWEI” Bitcoin and other first-generation cryptocurrencies allow…
the S&P500 Index

In short: The S&P measures the 500 largest companies in the U.S.A The S&P 500, or simply the S&P, is a stock market index that measures the stock performance of 500 large companies listed on stock exchanges in the United States. It is one of the most commonly followed equity indices, and many consider it to be…
the Dow Jones Index
In short: The Dow Jones measures the 30 largest companies in the U.S.A. The Dow Jones Industrial Average (DJIA) is perhaps the most widely followed stock market index in the world. Yet, very few people actually know what that the number represents just 30 companies. The following history and explanation…
What is payment for order flow?
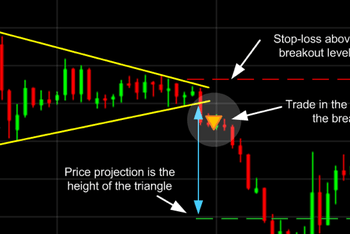
Chart Patterns – The Basics
Support And Resistance Lines
In short: Support and resistance trendlines are horizontally drawn lines to indicate where the price might end or gain strength. In stock market technical analysis, support and resistance are certain predetermined levels of the price of a security at which it is thought that the price will tend to stop and reverse. These levels are denoted by…
Candlesticks
Bar Charts
Bitcoin/Tulip-o-mania. History repeats…
What does GAS (and gwei) mean in crypto terms?

In short: “A blockchain network needs some form of energy to keep going, and this energy is usually the computational power that will help users complete orders. That energy is called gas or gas=fee. For the Etherium network the gasfee is measured in GWEI” Bitcoin and other first-generation cryptocurrencies allow…
the S&P500 Index

In short: The S&P measures the 500 largest companies in the U.S.A The S&P 500, or simply the S&P, is a stock market index that measures the stock performance of 500 large companies listed on stock exchanges in the United States. It is one of the most commonly followed equity indices, and many consider it to be…
the Dow Jones Index
In short: The Dow Jones measures the 30 largest companies in the U.S.A. The Dow Jones Industrial Average (DJIA) is perhaps the most widely followed stock market index in the world. Yet, very few people actually know what that the number represents just 30 companies. The following history and explanation…
What is payment for order flow?
Chart Patterns – The Basics
Support And Resistance Lines
In short: Support and resistance trendlines are horizontally drawn lines to indicate where the price might end or gain strength. In stock market technical analysis, support and resistance are certain predetermined levels of the price of a security at which it is thought that the price will tend to stop and reverse. These levels are denoted by…


