Categorie: indicators
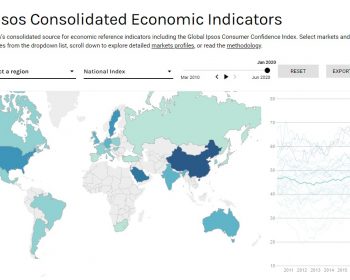
the IPSOS GCC index
Stochastic Oscillator Indicator
In short: A stochastic oscillator is an indicator comparing a closing price to a range of prices over a certain period of time. It is used to generate overbought and oversold trading signals. Developed by George C. Lane in the late 1950s, the Stochastic Oscillator is a momentum indicator that shows the location of…
Ichimoku Cloud Indicator
In short: The Ichimoku Cloud are 5 of indicators that show support and resistance levels, as well as momentum and trend direction. It also uses these figures to produce a “cloud” which attempts to forecast where the price may find support or resistance in the future. What is the Ichimoku Cloud Indicator? The Ichimoku Cloud…
Moving Average (MA)
Average True Range (ATR) indicator
In short: The ATR indicator takes the current period high/low range compared to the previous high/low range. It is most usefull in measuring the strength of a move. if a stock makes a move there will be an increase in volatility. In that case the ATR will be on the rise….
the Relative Strenght Index (RSI)
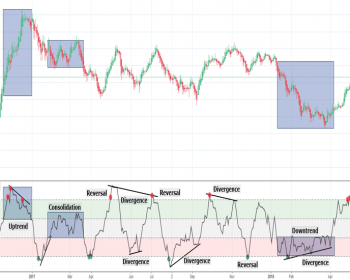
In short: The relative strength index tells you when a stock is overbought or oversold. The relative strength index (RSI) is a technical indicator used in the analysis of financial markets. It is intended to chart the current and historical strength or weakness of a stock or market based on the closing prices of a recent trading…
Rate Of Change (ROC) indicator
In short: The ROC Indicator is a momentum indicator. It measures the percentage of change compared to a previous period(s). With this you can see ahead of time if a stock is overbought or oversold or when the momentum changes. What is the rate of change Indicator (ROC) ? Rate…
Pivot Point Indicator

In short: a Pivot Point is a trend analyser by looking at the high, low and closing price from the previous trading session. A Pivot Point is a popular indicator commonly used by technical traders to determine the overall market trends, as well as potential support/resistance levels over different time frames. Floor…
MACD
In short: When the lines in the MACD crossover it means that a new trend forms. The MACD is the difference between the Moving Average-short and Moving Average-long. The Histogram is the difference between the two MA’s. MACD, short for moving average convergence/divergence, is a trading indicator used in technical analysis of stock prices, created by Gerald…
the IPSOS GCC index
Stochastic Oscillator Indicator
In short: A stochastic oscillator is an indicator comparing a closing price to a range of prices over a certain period of time. It is used to generate overbought and oversold trading signals. Developed by George C. Lane in the late 1950s, the Stochastic Oscillator is a momentum indicator that shows the location of…
Ichimoku Cloud Indicator
In short: The Ichimoku Cloud are 5 of indicators that show support and resistance levels, as well as momentum and trend direction. It also uses these figures to produce a “cloud” which attempts to forecast where the price may find support or resistance in the future. What is the Ichimoku Cloud Indicator? The Ichimoku Cloud…
Moving Average (MA)
Average True Range (ATR) indicator
In short: The ATR indicator takes the current period high/low range compared to the previous high/low range. It is most usefull in measuring the strength of a move. if a stock makes a move there will be an increase in volatility. In that case the ATR will be on the rise….
the Relative Strenght Index (RSI)
In short: The relative strength index tells you when a stock is overbought or oversold. The relative strength index (RSI) is a technical indicator used in the analysis of financial markets. It is intended to chart the current and historical strength or weakness of a stock or market based on the closing prices of a recent trading…
Rate Of Change (ROC) indicator
In short: The ROC Indicator is a momentum indicator. It measures the percentage of change compared to a previous period(s). With this you can see ahead of time if a stock is overbought or oversold or when the momentum changes. What is the rate of change Indicator (ROC) ? Rate…
Pivot Point Indicator

In short: a Pivot Point is a trend analyser by looking at the high, low and closing price from the previous trading session. A Pivot Point is a popular indicator commonly used by technical traders to determine the overall market trends, as well as potential support/resistance levels over different time frames. Floor…
MACD
In short: When the lines in the MACD crossover it means that a new trend forms. The MACD is the difference between the Moving Average-short and Moving Average-long. The Histogram is the difference between the two MA’s. MACD, short for moving average convergence/divergence, is a trading indicator used in technical analysis of stock prices, created by Gerald…


