Average Yearly Return

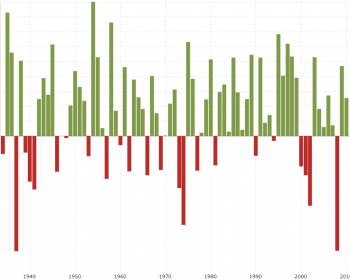
In short: The Average Yearly Return is the midpoint of several returns on investment added up and divided by the number of years; the average. The average annual return  is used by investors to measure the performance of investments over a period of time. It is a percentage which is used…

Continue reading

Moving Average (MA)

In short: The MA is the price average of a certain amount of time. For example MA15 is the average of the last 15 days. MA15, MA50, MA100, SMA, EMA Explained. In statistics, a moving average is a calculation used to analyze data points by creating a series of averages…

Continue reading

Line Chart

In short: A line chart connects data points using a line, usually from the closing price of each time period. The line chart is the most basic chart type and it uses only one data point to form the chart. When it comes to technical analysis, a line chart is…

Continue reading

the Vix Index

In short: The Volatility or Fear index measures the price swing in the markets for the next 30 days by looking at the price of options. What Is the CBOE Volatility Index (VIX)? Created by the Chicago Board Options Exchange (CBOE), the Volatility Index, or VIX, is a real-time market index that represents the…

Continue reading

Return On Investment

In short: The Rate Of Return or Return On Investment (R.O.I.) is a percentage of the total end value measured against the initial amount of the investment. Official definition: “A profitability measure that evaluates the performance of a business by dividing net profit by net worth“. Return on investment, or ROI,…

Continue reading

Pivot Point Indicator

In short: a Pivot Point is a trend analyser by looking at the high, low and closing price from the previous trading session. A Pivot Point is a popular indicator commonly used by technical traders to determine the overall market trends, as well as potential support/resistance levels over different time frames. Floor…

Continue reading