What is the-wiseguy.com?
We, Bill-Bull and The-Wiseguy, are comfortably living our lives not bothered by any investor or boss, maybe just our wifes. Bill-Bull is a long-term value investor who bases his decisions solely on technical analysis (wiki) and The-Wiseguy is a swing-/daytrader (wiki) who has a more fundamental buying decision based on the news of the day (and because of that gets stuck with certain shares for a long time). In these posts we are expressing our thoughts about the stock we picked and occasionally about the world.

The history of shares and the stockexchange.
What is our goal?
Our moto: "There are tens of thousands of shares in the world but only a few are good enough to be wiseguys" (just click the motto) . We think a warning is in place, as a Dutch saying goes: "Resultaten uit het verleden bieden geen garantie voor de toekomst" meaning something like past returns do not guarantee the future. That is why we stay vigilant and so should you by reguarly reading our website. … We hope you have a good time and hereby apologize upfront for hurting or insulting anyone. That is never our intention.
….Stay home.....Stay safe....Stay informed….
.....................
You can find most of what you need in the menu on top of this page.In The Strategy we lay down the most important rules and explain what we think is required.
In The List we have an always updated watchlist, the list of what we call Wiseguys, the 50%/5y companies.
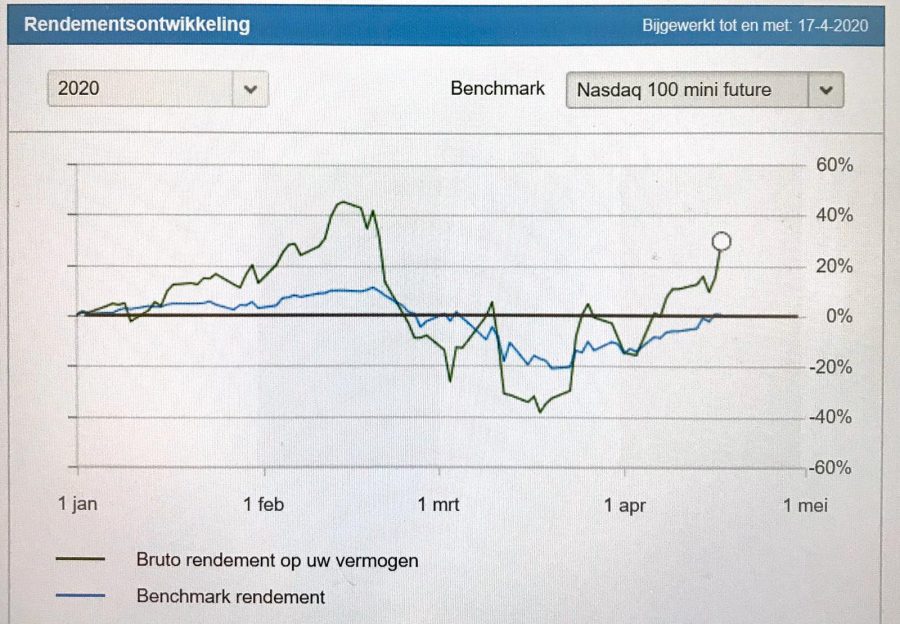
In The Performance. you can find out how we are doing this year and if we will reach our 40% annual profit.
And the most important pages are off course the messages we send out. All our buy and sell orders, the company bio and company stock charts, the TA and why we think you should buy or sell them (and at what moment in time). You can visit The Archive and you'll find the latest messages below:
Thanks for your time. If you liked what you are reading you can always buy me a coffee!
OCADO GROUP

Ocado Group plc operates as an online grocery retailer in the United Kingdom and internationally. The company operates through three segments: Ocado Retail, UK Solutions & Logistics, and International Solutions. It sells general merchandise products on its Ocado.com; and operates Fetch, a pet store, as well as Sizzle, a kitchen…
the Smart Money Index (SMI)
In short: SMI is an index of orders in the last half hour compared to the first half hour. The Smart Money Index, or Smart Money Flow Index, was popularized by Don Hayes in the 1990s and seeks to understand what the “smart money” is doing relative to the “dumb…
Fibonacci
In short: Fibonacci retracements are based on the key numbers identified by mathematician Leonardo Fibonacci in the 13th century. Fibonacci’s sequence is expressed as ratios, between the numbers in the series. Fibonacci Retracements are ratios used to identify potential reversal levels. These ratios are found in the Fibonacci sequence. The most popular Fibonacci…
Stochastic Oscillator Indicator
In short: A stochastic oscillator is an indicator comparing a closing price to a range of prices over a certain period of time. It is used to generate overbought and oversold trading signals. Developed by George C. Lane in the late 1950s, the Stochastic Oscillator is a momentum indicator that shows the location of…
Ichimoku Cloud Indicator
In short: The Ichimoku Cloud are 5 of indicators that show support and resistance levels, as well as momentum and trend direction. It also uses these figures to produce a “cloud” which attempts to forecast where the price may find support or resistance in the future. What is the Ichimoku Cloud Indicator? The Ichimoku Cloud…
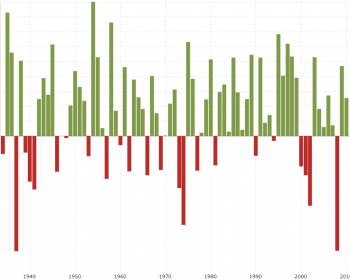
Average Yearly Return
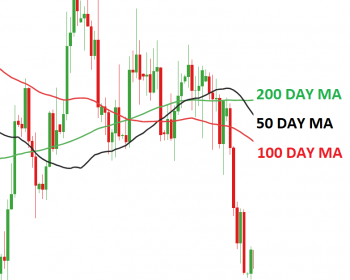
Moving Average (MA)
MSCI Inc

MSCI Inc., together with its subsidiaries, provides investment decision support tools for the clients to manage their investment processes worldwide. The company operates through four segments: Index, Analytics, ESG, and Real Estate. The Index segment primarily provides equity indexes for use in various areas of the investment process, including index-linked…
Please keep in mind that the-wiseguy.com provides high-quality information. However detailed and excellent it might be. It is not financial advice.
Our lawyer would say: The-wiseguy.com tries to help you form an opinion on buying or selling a certain security. We will never tell you to do so. Also we may already hold a position in a certain stock or may never buy it at all. Our information does not take in account your investment objectives, particular needs or financial situation. Therefor we are not responsible for any gains or losses you may experience. Any security mentioned should be examined with ones own due diligence. Always consult a licensed and trustworthy profesional before making a financial decision.


