What is the-wiseguy.com?
We, Bill-Bull and The-Wiseguy, are comfortably living our lives not bothered by any investor or boss, maybe just our wifes. Bill-Bull is a long-term value investor who bases his decisions solely on technical analysis (wiki) and The-Wiseguy is a swing-/daytrader (wiki) who has a more fundamental buying decision based on the news of the day (and because of that gets stuck with certain shares for a long time). In these posts we are expressing our thoughts about the stock we picked and occasionally about the world.

Candlesticks

Bar Charts
What is our goal?
Our moto: "There are tens of thousands of shares in the world but only a few are good enough to be wiseguys" (just click the motto) . We think a warning is in place, as a Dutch saying goes: "Resultaten uit het verleden bieden geen garantie voor de toekomst" meaning something like past returns do not guarantee the future. That is why we stay vigilant and so should you by reguarly reading our website. … We hope you have a good time and hereby apologize upfront for hurting or insulting anyone. That is never our intention.
….Stay home.....Stay safe....Stay informed….
.....................
You can find most of what you need in the menu on top of this page.In The Strategy we lay down the most important rules and explain what we think is required.
In The List we have an always updated watchlist, the list of what we call Wiseguys, the 50%/5y companies.
In The Performance. you can find out how we are doing this year and if we will reach our 40% annual profit.
And the most important pages are off course the messages we send out. All our buy and sell orders, the company bio and company stock charts, the TA and why we think you should buy or sell them (and at what moment in time). You can visit The Archive and you'll find the latest messages below:
Thanks for your time. If you liked what you are reading you can always buy me a coffee!
LIONTRUST

Liontrust Asset Management Plc is a publicly owned investment manager. The firm also launches equity, fixed income, , multi-asset and managed funds for its clients. It invests into the public equity and multi-asset markets across the globe. The firm was formerly known as River and Mercantile Investment Management Limited. Liontrust…
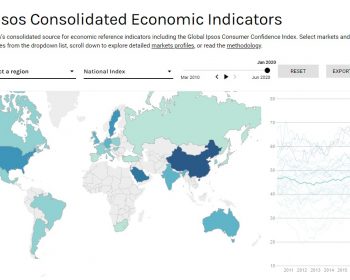
the IPSOS GCC index
WORLD’S FIRST FLYING CAR HITS THE ROAD
Thoughts: “Good news for the Long-Term Investor”
Insider Trading Opportunity
What are graphics processing units doing in our List of Wiseguys?
HFT – High Frequency Trading (is helping)

Gone are the dealers on NASDAQ and the specialists at the NYSE. Instead, a company’s stock can now be traded on up to sixty competing venues where a computer matches incoming orders. A majority of quotes are now posted by high-frequency traders (HFTs), making them the dominant source of liquidity in the market.
SARTORIUS VZ

Sartorius Aktiengesellschaft supplies pharmaceutical and laboratory equipment worldwide. It operates in two divisions, Bioprocess Solutions, and Lab Products & Services. The company offers live cell analysis system, and cell analysis reagents and consumables; cell culture media, including antibody and recombinant protein, viral vaccines, and regenerative medicine media; and multi-parallel, single-use,…
Please keep in mind that the-wiseguy.com provides high-quality information. However detailed and excellent it might be. It is not financial advice.
Our lawyer would say: The-wiseguy.com tries to help you form an opinion on buying or selling a certain security. We will never tell you to do so. Also we may already hold a position in a certain stock or may never buy it at all. Our information does not take in account your investment objectives, particular needs or financial situation. Therefor we are not responsible for any gains or losses you may experience. Any security mentioned should be examined with ones own due diligence. Always consult a licensed and trustworthy profesional before making a financial decision.


